
Design For Reliability (DfR)
Read More

An electronic device can fail due to six independent primary failure modes: A, B, C, D, E and F. The component fails if mode A, mode B or mode F occurs. If mode C, mode D or mode E occurs alone, the component does not fail; however, the component will fail if any two (or more) of these modes occur (i.e., C and D; D and E; E and C; or C, D and E). The objective is to analyze each data set using the 2-parameter Weibull distribution with MLE and to determine the lower 1-sided 90% confidence interval on the reliability of this component at 100 hours.
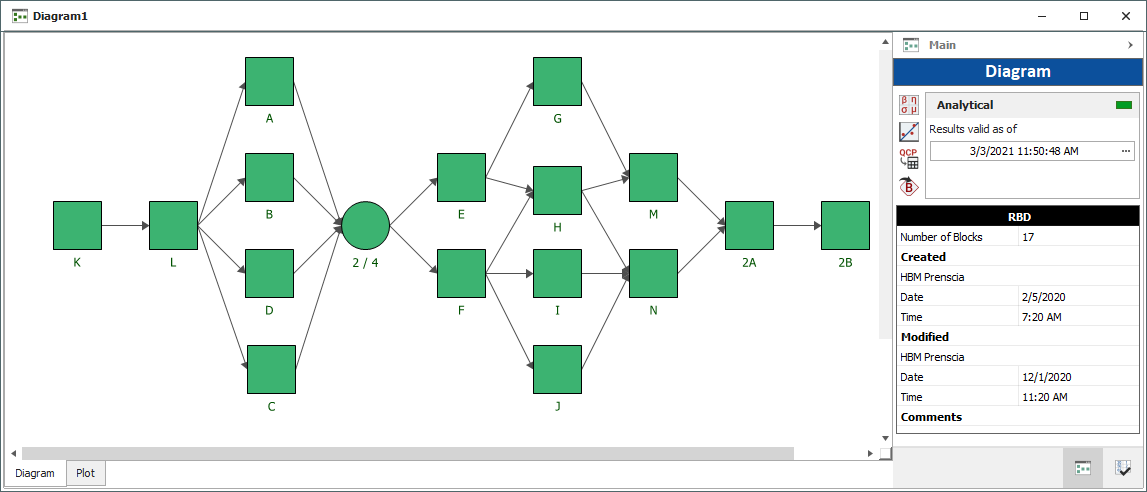
The following tables present the time-to-failure data for these modes (in hours).
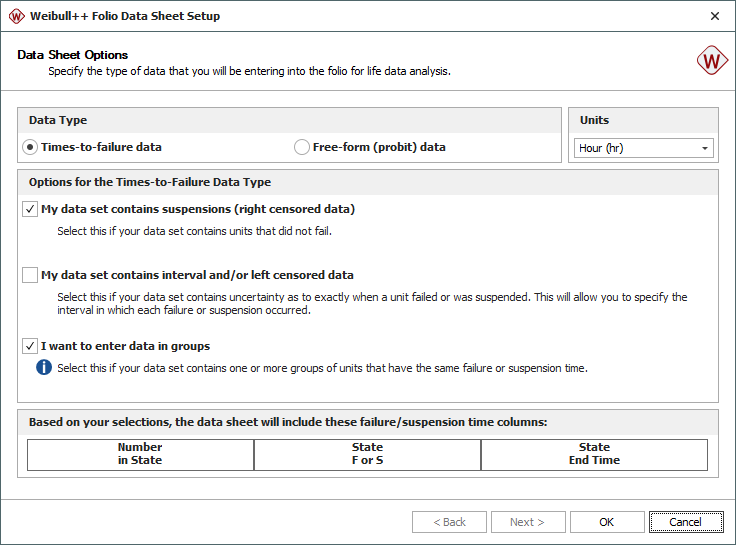
Step 1: Using Weibull++, the first step is to create a new data sheet for grouped times-to-failure data with suspensions.
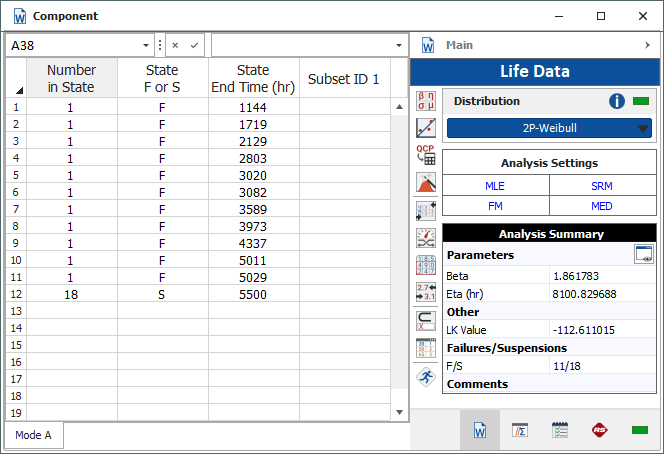
Step 2: Rename the folio to "Component" and the data sheet to "Mode A." Enter the data given for Mode A and use the 2-parameter Weibull distribution with MLE to calculate the parameters, as shown next.
Step 3: Insert another data sheet of the same type named "Mode B," enter the data given for Mode B and calculate the parameters. Repeat for the remaining failure modes.
Step 4: Choose Home > Insert > Diagram.
Step 5: Build the RBD that describes the reliability-wise configuration of the failure modes, as shown next.
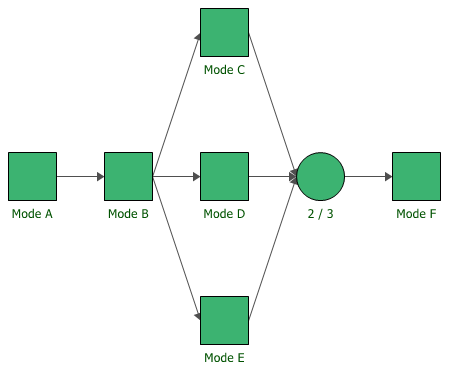
Note that the node in the diagram requires 2 of the 3 paths to succeed.
Step 6: Click Calculate to analyze the diagram.

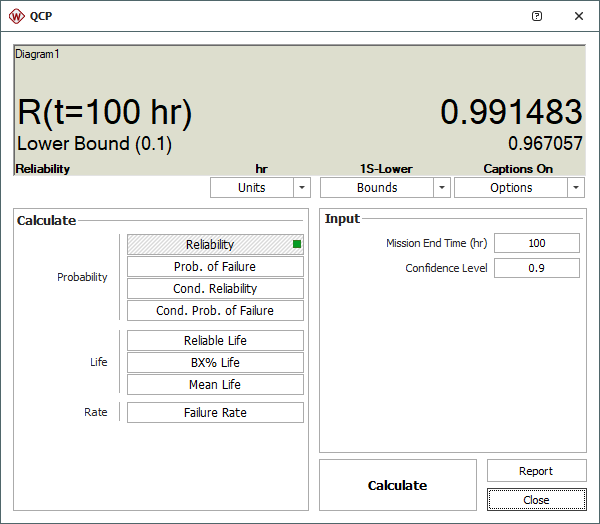
Then use the Quick Calculation Pad (QCP) to calculate the reliability at 100 hours with the lower 1-sided 90% confidence bound, as shown next.


This will bring together HBM, Brüel & Kjær, nCode, ReliaSoft, MicroStrain and Discom brands, helping you innovate faster for a cleaner, healthier, and more productive world.